
Feedback Data Integration That Drives Action
September 30, 2026
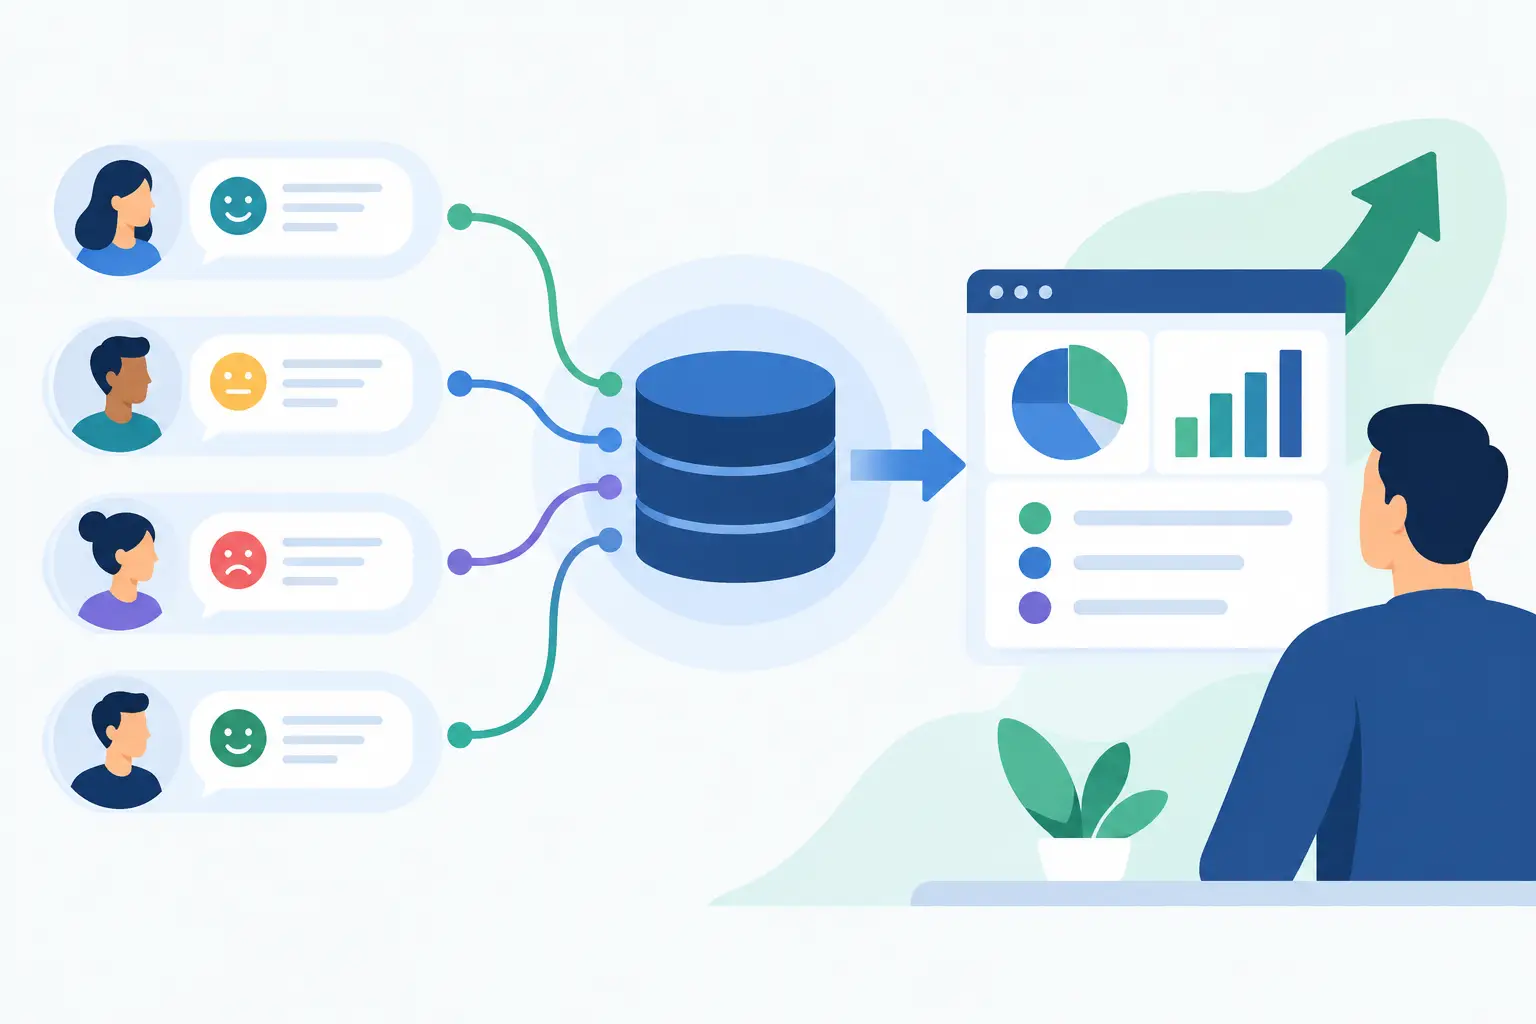
A customer reports the same service issue in a survey, an email thread, and a complaint record. A field technician describes the likely cause in work-order notes. If those records remain in separate systems, the organization may count three problems, miss the operational cause, and assign no one to resolve it. Feedback data integration prevents that failure by bringing disconnected feedback into a shared system for analysis, decisions, and follow-through.
The goal is not simply to collect more data in one place. It is to create an operating view of what customers, employees, partners, and frontline teams are saying, what those signals mean, and which actions deserve ownership. That distinction matters because most feedback programs break down after collection. The survey closes, the inbox fills, the dashboard refreshes, and the organization still lacks a clear path from evidence to improvement.
What feedback data integration actually does
Feedback data integration combines qualitative and quantitative feedback from existing organizational sources and organizes it around a common analytical structure. Sources may include surveys, customer emails, complaint systems, support records, call summaries, work-order notes, employee comments, and customer-experience records.
Integration does not mean flattening every source into a generic spreadsheet. Each source carries useful context. A survey may provide respondent attributes and rating scales. An email may preserve urgency, chronology, and detailed language. A work order may connect feedback to an asset, location, technician, or service event. A useful integration process retains that context while making records comparable across sources.
The operational result is a central feedback record that can be filtered, classified, analyzed, and assigned. Teams can see not only that customers are dissatisfied, but whether dissatisfaction is concentrated around a specific location, product line, service stage, issue type, or recurring root cause.
Why disconnected feedback creates poor decisions
Most organizations already have substantial feedback volume. Their problem is fragmentation. Survey results are owned by the CX team. Complaints sit with compliance or customer care. Support leaders work from ticketing systems. Operations teams rely on work-order histories and local knowledge. Each group may have a partial view that is accurate within its own system but incomplete at the organizational level.
That fragmentation creates three common decision errors. First, teams overvalue what is easiest to measure, such as a rating score, while underusing the explanation embedded in open text. Second, they treat repeated reports as isolated cases because records cannot be connected across channels. Third, action becomes reactive. Staff close individual tickets without seeing the process failure that keeps generating them.
A shared feedback environment changes the unit of analysis. Instead of asking, “What did the latest survey say?” leaders can ask, “What issue patterns are increasing across all relevant feedback, who is affected, and what action will reduce recurrence?” That is a more useful question for retention, service quality, and operational performance.
Build the integration around decisions, not systems
A common mistake is starting with a long inventory of applications and attempting to connect everything at once. That approach can produce a large repository with unclear value. Start instead with the decisions the organization needs to make more reliably.
For example, a service leader may need to identify the primary causes of repeat complaints. An employee-experience team may need to determine whether comments about workload differ by department or manager level. A product team may need to distinguish between onboarding confusion, defects, and policy friction in customer feedback.
These decisions determine which sources should be integrated first, which fields need to be standardized, and which classifications will be meaningful. They also set a practical boundary. Not every data source belongs in the first phase. A source should be prioritized when it adds important evidence to a decision, fills a known blind spot, or helps connect feedback to an accountable operational owner.
Preserve source context and create common fields
Every integrated record should retain its original source, date, respondent or case identifier when appropriate, and relevant operational metadata. This makes analysis traceable. A dashboard may show a rising issue category, but a manager should be able to inspect the underlying comments and understand whether the pattern is coming from surveys, complaints, emails, or several channels.
At the same time, organizations need common fields that work across sources. Typical examples include business unit, location, product or service, customer segment, journey stage, issue category, sentiment or experience outcome, and owner. The exact schema depends on the business. A healthcare provider, manufacturer, utility, and B2B software company should not force their feedback into identical categories.
The trade-off is straightforward: too little standardization leaves data difficult to compare, while too much standardization strips away the detail needed to explain a problem. Use a small set of enterprise-level fields, then allow source-specific attributes where they add operational meaning.
Turn unstructured text into an analytical asset
Open-ended feedback is often the most direct explanation of why a score changed or why a customer escalated. It is also the hardest material to use at scale. Manual reading can be valuable for a small project, but it becomes inconsistent and slow when teams are processing thousands of emails, comments, and notes.
Text classification gives teams a repeatable way to organize this material. A classification library might separate billing errors from confusing bills, delivery delays from missed appointments, and staff courtesy from communication clarity. These distinctions are not cosmetic. They determine which department investigates and what corrective action is appropriate.
Automated methods can accelerate classification, surface themes, and help route new records for review. They should not operate without governance. Category definitions need business owners, sample-based quality checks, and periodic refinement as products, policies, or customer language change. A category that is too broad produces vague actions. A category that is too narrow can create a taxonomy no one can maintain.
Guided Analysis is particularly useful here because it gives nontechnical teams a defined route from raw comments to patterns, root causes, and recommended next steps. The objective is not to replace expert judgment. It is to apply expert judgment consistently and make the reasoning visible to the people responsible for action.
Connect insight to an action workflow
Feedback intelligence has limited value when it ends in a dashboard. Leaders need a way to move from a finding to an owned response, especially when an issue crosses departments.
A practical workflow begins with an insight statement: what is happening, where it is occurring, how large the pattern is, and what evidence supports it. The team then documents the likely root cause, selects an action, assigns an owner, sets a due date, and tracks status. When the action is complete, the organization can monitor the relevant feedback signals to assess whether the change improved the experience.
This is where an Action Backlog becomes more than a task list. It creates a visible connection between the feedback pattern, the decision, and the accountable work. It also helps leadership distinguish between issues that require local correction and issues that justify broader process redesign.
StatQuestions supports this lifecycle by centralizing feedback data from multiple sources, organizing unstructured text, and connecting dashboards and Guided Analysis to root-cause work and action tracking. The platform approach matters because teams should not have to export comments from one tool, classify them in another, present findings elsewhere, and manage follow-up in an unrelated project system.
Measure whether integration is improving operations
The success of feedback data integration should not be judged by the number of connected sources alone. A larger data inventory can increase noise if teams do not have clear questions, classification discipline, or action ownership.
Better measures focus on operational use. Track how quickly feedback is available for analysis, how much of the relevant text is consistently classified, how often insights are tied to a named owner, and how long corrective actions remain open. Monitor whether recurring issues decline after changes are implemented. Where possible, connect those changes to business outcomes such as reduced repeat contacts, lower complaint volume, stronger satisfaction, improved retention, or fewer service failures.
Adoption is another useful measure. If managers continue exporting data into personal spreadsheets, the integrated environment is not yet serving their workflow. That may indicate missing fields, unclear dashboards, limited trust in classifications, or a process issue rather than a technology issue.
Start with one high-value feedback loop
The most effective first project is usually a recurring problem with enough feedback volume to reveal patterns and enough operational ownership to support change. It might be repeat service complaints, post-installation survey comments, renewal-risk emails, or employee feedback about a specific process.
Integrate the relevant sources, define a manageable classification structure, review the evidence with the people closest to the work, and create an action path for the highest-priority causes. Once that loop produces credible insight and visible follow-through, expansion becomes easier because the organization can see how connected feedback changes decisions.
The useful test is simple: when a customer, employee, or stakeholder raises a concern, can the organization connect that signal to related evidence, identify the responsible process, and track a response to completion? If not, the next integration priority is already in view.